The right hand side of your brain goes "ooh bla dee"
And the left hand side of your brain goes, "what does it mean???"
-- Rahsaan Roland Kirk
So what are we to make of the readings from the Hazelton purple air monitor?
Well, testing has been done by the California South Coast Air Quality Management District and they found that correlation of readings was very good with these sensors right beside much more expensive Federal Equivalent Method monitors that cost a hundred times more. See mega details here, especially page 12 where the PM2.5 readings are reported. The short version is here.
A caveat may be in order. These sensors are not as good as the BAMs used by BC Ministry of Environment. But for 1% of the cost this is pretty good shootin’. Only in very cold weather or extremely high PM conditions are the readings suspect, and by then the state of affairs is obvious.
When reading the AQI details from the monitor you’ll see if you scroll down a figure shown as R squared. This indicates the degree of agreement between the two particle counters in this unit, values closer to 1 indicate better agreement. In the first week of operation I actually haven’t seen any other readings than 1. Pretty good. Also a note about the AQI. On the top left of the Hazelton map you can see this settings box:
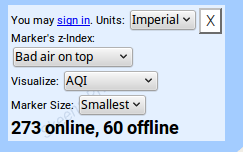
And its visualize AQI labels a pulldown menu that you can change to show mass in micrograms per cubic metre, a display independent value that is my personal choice, offering best comparability with readings from other places. You’ll see that you can change display units to metric, another useful touch. The bottom left corner of the page has the toggle for map view and satellite view.
The data reported to the map mothership is recorded and is available online for downloads. This link will take you to a page listing all the sensors, scroll down or search for cleanairplan.ca-Hazelton-01. There are two of them, one for each particle counter, A and B. Specify the dates at the top of the page, click to the left of the counters you want and then click on download, either primary or secondary.
There is a sample data file here. click to download into your favourite spreadsheet and noodle away all you like.
And we can take this into account too:
“These results highlight the importance of evaluating the sensor
under the target conditions and developing an appropriate
correction factor if the user wants to compare low-cost sensor
results to FEM/FRMs. In spite of these challenges, these
sensors are a promising tool for identifying relative increases
or decreases in PM concentration, complementing sparsely
distributed monitoring stations and for assessing and minimizing
exposure to PM.” – Kerry Kelly et al
– http://dx.doi.org/10.1016/j.envpol.2016.12.039
I can add more to this but it would be useful to have some questions about what’s desirable so why not email editor@hazelton.cleanairplan.ca and get some help?